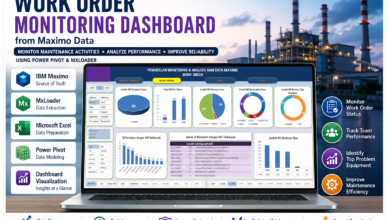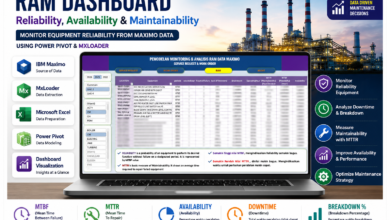
Service Request Monitoring Dashboard Using Power Pivot and MxLoader
In today’s digital industrial landscape, data has become an essential part of decision-making. Nearly every major industry relies on data to make operations faster, more accurate, and easier to monitor. One industry that depends heavily on data is the power generation industry.
In a power plant, thousands of pieces of equipment operate continuously, 24 hours a day. From boilers, turbines, conveyors, pumps, and fans to electrical panels and instrumentation, every asset must be constantly monitored. If even a single critical piece of equipment fails, electricity production can be disrupted.
This is why maintenance monitoring is so important. One of the most widely used maintenance management systems is IBM Maximo, an Enterprise Asset Management (EAM) platform used to manage Service Requests (SRs), Work Orders (WOs), equipment history, maintenance schedules, and asset information.
For this project, I developed a simple yet powerful dashboard titled:
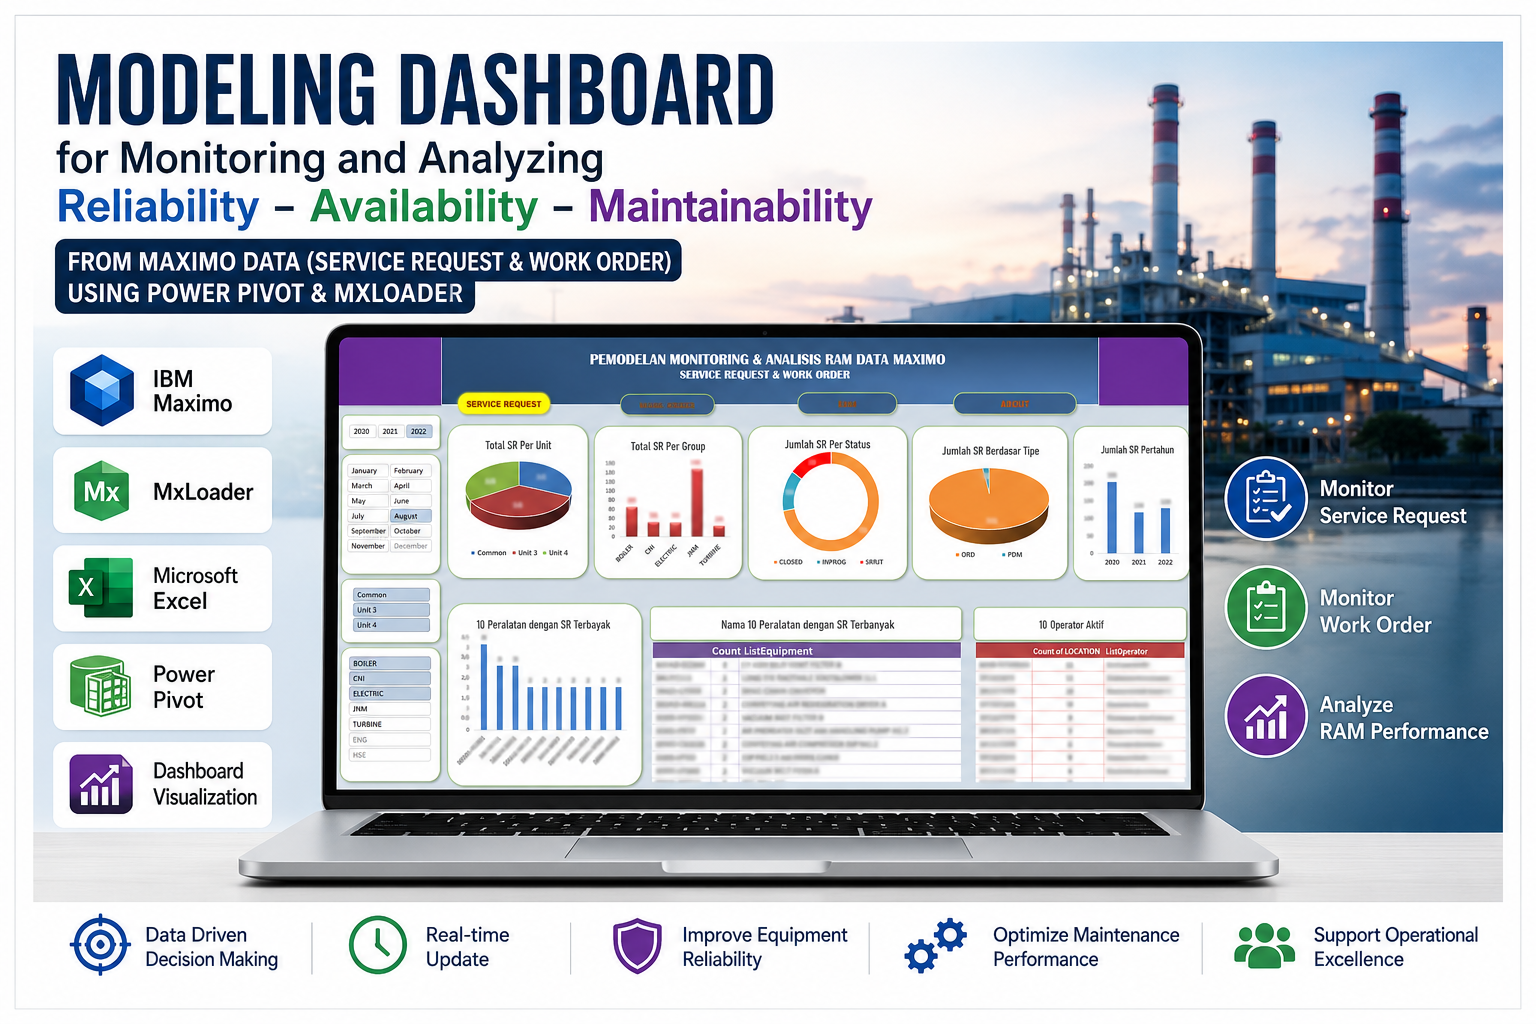
“Modeling Dashboard for Monitoring and Analyzing Reliability, Availability, and Maintainability (RAM) from Maximo Data (Service Requests and Work Orders) Using Power Pivot and MxLoader.”
The dashboard combines several easy-to-use tools that significantly improve maintenance data monitoring while allowing online updates.
What Are Reliability, Availability, and Maintainability (RAM)?
Before exploring the dashboard, let’s briefly review the core concepts behind this project.
Reliability
Reliability refers to an equipment’s ability to operate without failure over a specified period.
Examples:
• A conveyor operates continuously for three months without tripping.
• A boiler feed pump experiences no breakdown during operation.
The less frequently equipment fails, the higher its reliability.
Availability
Availability measures how ready equipment is for operation whenever it is needed.
Examples:
• A standby pump is immediately available when the primary pump trips.
• A turbine can be returned to service quickly without extended repair time.
Availability is influenced by several factors:
• Failure frequency
• Repair duration
• Spare parts availability
Maintainability
Maintainability refers to how easily and quickly equipment can be restored after a failure.
Examples:
• A filter can be easily removed and cleaned.
• An electric motor can be replaced quickly thanks to maintenance-friendly design.
The faster repairs can be completed, the better the equipment’s maintainability.
Why Was This Dashboard Developed?
Maintenance departments generate enormous amounts of data. Unfortunately, much of this information simply becomes archived rather than being fully utilized.
Typical maintenance databases contain:
• Thousands of Service Requests
• Numerous Work Orders
• Extensive equipment failure histories
• Operator activity records
• Maintenance logs
When all of this information exists only as long Excel tables or database records, it becomes difficult to extract meaningful insights quickly.
This dashboard was developed to:
• Simplify maintenance monitoring
• Support maintenance analysis
• Identify problematic equipment
• Detect failure trends
• Improve decision-making
It allows engineers and maintenance planners to understand plant conditions from a single screen.
Tools Used
The project utilizes several straightforward yet highly effective tools.
IBM Maximo
IBM Maximo is an Enterprise Asset Management (EAM) software platform designed to manage industrial assets and maintenance activities.
The dashboard retrieves data such as:
• Service Requests
• Work Orders
• Equipment Lists
• Operator information
• Work status
• Maintenance history
Maximo serves as the primary data source.
MxLoader
MxLoader is an Excel-based utility that enables users to:
• Download data from Maximo
• Upload data
• Update records
• Export information
Its advantages include:
• Easy to use
• Fast performance
• No complex programming required
• Suitable for engineers and maintenance personnel
In this project, MxLoader retrieves maintenance data from the Maximo server, allowing the dashboard to remain up to date.
Microsoft Excel
Although simple in appearance, Microsoft Excel remains one of the most powerful data analysis tools available.
Excel was used for:
• Data cleaning
• Initial data processing
• Pivot tables
• Formula creation
• Data integration across multiple tables
Power Pivot
Power Pivot is an advanced Excel feature that enables users to build relational data models similar to miniature databases.
Power Pivot allows users to:
• Connect multiple tables
• Create relationships
• Write DAX formulas
• Perform automated calculations
It serves as the analytical engine behind the dashboard.
Dashboard Visualization
The processed data is presented using:
• Pie charts
• Bar charts
• Donut charts
• KPI indicators
• Ranking tables
• Interactive filters
The objective is to make maintenance information easy to interpret.
Dashboard Overview
The dashboard features a clean and informative layout, presenting all essential information on a single page so users don’t need to navigate multiple reports.
To protect company confidentiality, certain values and sensitive information shown in the screenshots have been blurred or anonymized.
The dashboard consists of several major sections.
Year and Month Filters
Interactive filters allow users to select:
• Year
• Month
• Unit
• Equipment Group
Examples include:
• Viewing Service Requests for August
• Displaying only Unit 3
• Analyzing only boiler-related equipment
These filters make the dashboard flexible and interactive.
Total Service Requests by Unit
This section displays the number of Service Requests for each generating unit.
Examples:
• Common Area
• Unit 3
• Unit 4
The visualization helps users:
• Identify which unit experiences the most issues
• Compare unit performance
• Prioritize maintenance activities
If one unit records significantly more Service Requests than others, engineers can investigate further.
Total Service Requests by Equipment Group
The dashboard categorizes Service Requests by equipment groups such as:
• Boiler
• CNI
• Electrical
• Turbine
This helps maintenance teams determine which plant systems experience the highest number of failures.
For example:
• If the Boiler group records the highest number of Service Requests, additional inspections may be necessary.
• If Turbine-related Service Requests suddenly increase, preventive actions may be required.
Simple analyses like these provide valuable maintenance insights.
Service Requests by Status
The dashboard tracks work status, including:
• Closed
• In Progress
• SRJT (or other custom statuses)
This enables users to monitor:
• Completed work
• Ongoing work
• Maintenance backlog
A high number of “In Progress” jobs may indicate:
• Insufficient manpower
• Spare parts shortages
• Inefficient maintenance prioritization
Service Requests by Type
The dashboard also classifies maintenance activities according to work type.
Examples include:
• ORD
• PDM
This helps engineers understand which maintenance activities dominate plant operations.
Annual Service Request Trends
A yearly trend chart allows users to evaluate long-term maintenance performance.
Questions that can be answered include:
• Are equipment failures increasing?
• Is reliability improving?
• Is the maintenance strategy producing positive results?
Trend analysis plays an important role in continuous improvement.
Top 10 Equipment with the Highest Number of Service Requests
One of the most valuable sections of the dashboard is the equipment ranking.
It displays:
• Equipment with the highest number of Service Requests
• Total cases
• Equipment rankings
This information supports:
• Root Cause Analysis (RCA)
• Identification of “bad actor” equipment
• Overhaul prioritization
For example, if a particular pump consistently ranks near the top, possible causes may include:
• Design limitations
• Operational issues
• Excessive vibration
• Lubrication problems
Equipment Details
In addition to ranking charts, the dashboard displays detailed equipment names.
This information helps:
• Maintenance planners
• Supervisors
• Engineers
• Operators
identify assets that require special attention.
Active Operators
The dashboard also tracks maintenance personnel activity.
This information helps supervisors:
• Monitor maintenance activities
• Evaluate workload distribution
• Manage manpower allocation
Why Is This Dashboard Valuable?
Many people believe dashboards require expensive software or complex programming.
This project demonstrates that a well-designed Excel dashboard can be remarkably powerful when supported by reliable data.
Easy to Understand
The visualizations are intentionally simple, allowing:
• Engineers to interpret data quickly
• Operators to understand maintenance conditions
• Supervisors to make faster decisions
Even users with limited knowledge of data analytics can easily understand the dashboard.
Online Data Updates
Thanks to the integration of MxLoader and IBM Maximo, maintenance data can be refreshed periodically without rebuilding the dashboard from scratch.
No Complex Programming Required
This project demonstrates that industrial data analytics does not always require advanced programming skills.
Using only:
• Microsoft Excel
• Power Pivot
• Pivot Tables
• Dashboard visualizations
it is possible to build an effective maintenance monitoring system.
Better Decision-Making
The dashboard helps management determine:
• Maintenance priorities
• Critical equipment
• Problematic plant areas
• Reliability trends
As a result, decisions become data-driven rather than relying solely on experience or intuition.
Challenges During Development
Like any data analytics project, several challenges were encountered.
Inconsistent Data Quality
Maintenance databases often contain issues such as:
• Inconsistent equipment names
• Missing values
• Duplicate records
• Inconsistent status codes
Therefore, data cleaning became one of the most important project stages.
Large Data Volumes
Maximo databases can contain massive amounts of information.
Without proper optimization:
• Excel files become slow
• Dashboards lose responsiveness
• Formulas become inefficient
Power Pivot played a critical role in managing these large datasets efficiently.
Choosing the Right Visualizations
Not every chart is appropriate for every dataset.
Common issues include:
• Overcrowded pie charts
• Excessive color usage
• Difficult-to-read layouts
A successful dashboard should remain simple while emphasizing the most important information.
Lessons Learned
This project provided several valuable insights.
Data Analytics Is Valuable for Engineers
Data analytics is not exclusively for IT professionals or programmers.
Engineers can also leverage analytics for:
• Maintenance
• Operations
• Reliability engineering
• Energy analysis
Excel Remains an Extremely Powerful Tool
Despite the availability of modern software platforms, Excel continues to be one of the most versatile engineering tools.
When used effectively, Excel can function as a:
• Mini database
• Dashboard platform
• Reporting tool
• Analytics solution
Visualization Improves Analysis
Large tables are often difficult to interpret.
When transformed into visual charts:
• Trends become obvious
• Problems are identified more quickly
• Information becomes easier to understand
Future Development Opportunities
The dashboard can be further expanded in several directions.
Potential enhancements include:
• Power BI integration
• Real-time monitoring
• Predictive maintenance
• Machine learning
• Automated notification systems
• Mobile dashboards
Power BI Integration
Migrating the dashboard to Power BI could provide:
• A more modern interface
• Cloud-based sharing
• Mobile accessibility
• Real-time data refresh
This would represent an important step toward digital maintenance transformation.
Predictive Maintenance
In the future, Service Request and Work Order data could be used to:
• Predict equipment failures
• Estimate future breakdowns
• Optimize maintenance schedules
For example, if vibration levels consistently increase before equipment failure, the system could automatically issue an early warning.
The Importance of Data Privacy
Industrial data is highly confidential.
For that reason, throughout this article and the dashboard screenshots:
• Certain numerical values have been anonymized.
• Specific names have been blurred.
• Sensitive company information has been intentionally omitted.
Protecting confidentiality is an essential part of professional engineering practice.
Conclusion
The project “Modeling Dashboard for Monitoring and Analyzing Reliability, Availability, and Maintainability from Maximo Data Using Power Pivot and MxLoader” demonstrates how readily available tools can be combined to build an effective maintenance monitoring system.
By utilizing:
• IBM Maximo
• MxLoader
• Microsoft Excel
• Power Pivot
maintenance records that once existed only as lengthy spreadsheets can be transformed into an intuitive, visual dashboard.
The dashboard supports:
• Service Request monitoring
• Work Order tracking
• Equipment reliability analysis
• Critical asset identification
• Data-driven decision-making
Although developed using relatively simple software, the dashboard provides valuable insights for maintenance and reliability management in power plants.
More importantly, this project illustrates that today’s engineers must understand not only equipment and plant operations, but also data analytics and digital tools.
As the industry continues to evolve, the future of maintenance is increasingly driven by:
• Digitalization
• Smart maintenance
• Predictive analytics
• Data-driven decision-making
And it all begins with the ability to transform raw data into meaningful information.