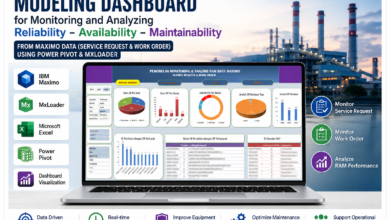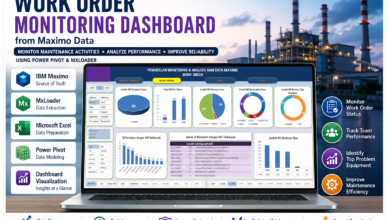
Reliability, Availability, and Maintainability (RAM) Dashboard from Maximo Data
Monitoring Equipment Reliability Using Power Pivot and MxLoader
In today’s industrial world, maintenance is no longer just about repairing broken equipment. It has evolved into a much broader discipline. Industries no longer aim simply to keep equipment running—they also strive to ensure that equipment:
– Remains reliable
– Is consistently available
– Can be maintained efficiently
– Does not cause significant downtime
This is why the concept of Reliability, Availability, and Maintainability (RAM) has become essential in modern engineering and maintenance.
In this project, I developed a RAM Monitoring Dashboard using IBM Maximo data, titled:
“Reliability, Availability, and Maintainability (RAM) Dashboard from Maximo Data using Power Pivot and MxLoader.”
This dashboard is the third installment in a series of maintenance dashboards:
1. Service Request (SR) Dashboard
2. Work Order (WO) Dashboard
3. Reliability, Availability, and Maintainability (RAM) Dashboard
While the first dashboard focused on:
– Service Request monitoring
– Work Order monitoring
– Equipment reliability
– Downtime analysis
– Maintainability analysis
– Availability performance
The dashboard was developed using:
– IBM Maximo
– MxLoader
– Microsoft Excel
– Power Pivot
– Dashboard Visualization
Although it uses relatively simple tools, the dashboard provides valuable insights for maintenance and reliability engineering.
What Is RAM?
Before exploring the dashboard, let’s first understand what RAM means.
RAM stands for:
– Reliability
– Availability
– Maintainability
These three performance indicators are critical in industrial operations because they directly measure equipment performance.
Reliability
Reliability is the ability of equipment to operate without failure over a specified period of time.
The less frequently equipment fails, the higher its reliability.
Simple examples include:
– A pump operates continuously for six months without tripping.
– A conveyor runs throughout plant operations without experiencing a breakdown.
Such equipment is considered highly reliable.
Availability
Availability measures the readiness of equipment to perform its intended function whenever it is needed.
Even if equipment occasionally fails, it can still achieve high availability if repairs are completed quickly.
Availability is influenced by:
– Failure frequency
– Downtime duration
– Repair speed
Maintainability
Maintainability refers to how easily and quickly equipment can be restored to operating condition after a failure.
Examples include:
– Filters that are easy to replace
– Valves that are easy to disassemble
– Motors designed for easy maintenance
The faster equipment can be repaired, the better its maintainability.
Why Was the RAM Dashboard Developed?
A power plant contains thousands of pieces of equipment operating continuously, 24 hours a day.
When even one critical asset experiences a failure:
– Electricity production may be disrupted.
– Plant efficiency decreases.
– Maintenance costs increase.
– In severe cases, the plant may shut down.
Engineers therefore need to identify:
– Which equipment fails most frequently
– Which equipment experiences the most downtime
– Which equipment has poor reliability
– Which equipment should receive maintenance priority
The RAM Dashboard was created to support these objectives.
Dashboard Objectives
The dashboard was designed to:
– Monitor equipment reliability
– Analyze downtime
– Measure breakdown rates
– Support maintenance planning
– Assist reliability analysis
– Improve decision-making
With a single dashboard screen, engineers can quickly evaluate overall equipment performance.
Tools Used
This project was developed using several core tools.
IBM Maximo
IBM Maximo is an Enterprise Asset Management (EAM) platform used for:
– Asset management
– Maintenance management
– Work Order management
– Maintenance history management
The dashboard’s primary data source comes directly from Maximo.
The imported data includes:
– Failure history
– Downtime records
– Work Orders
– Operating hours
– Equipment lists
– Failure data
Maximo serves as the central database for this project.
MxLoader
MxLoader is used to transfer data from Maximo into Excel.
Its primary functions include:
– Exporting data
– Uploading data
– Updating records
– Synchronizing information
Key advantages of MxLoader include:
– Lightweight
– Fast
– Easy to use
– No complex programming required
In this project, MxLoader enables the dashboard to remain easily updateable.
Microsoft Excel
Excel serves as the primary data processing tool.
It is used for:
– Data cleaning
– Initial data processing
– Sorting
– Filtering
– Formula creation
– Basic visualization
Although simple, Excel remains an extremely powerful platform for industrial data analytics.
Power Pivot
Power Pivot is a key component of this dashboard.
It enables users to:
– Build data models
– Create relationships between tables
– Develop DAX formulas
– Process large datasets efficiently
Power Pivot makes the dashboard more dynamic and improves performance.
Dashboard Visualization
After processing, the data is presented through:
– Monitoring tables
– KPI indicators
– Interactive filters
– Reliability analysis
– Maintenance performance indicators
The objective is to make complex maintenance data easier to read and analyze.
Dashboard Overview
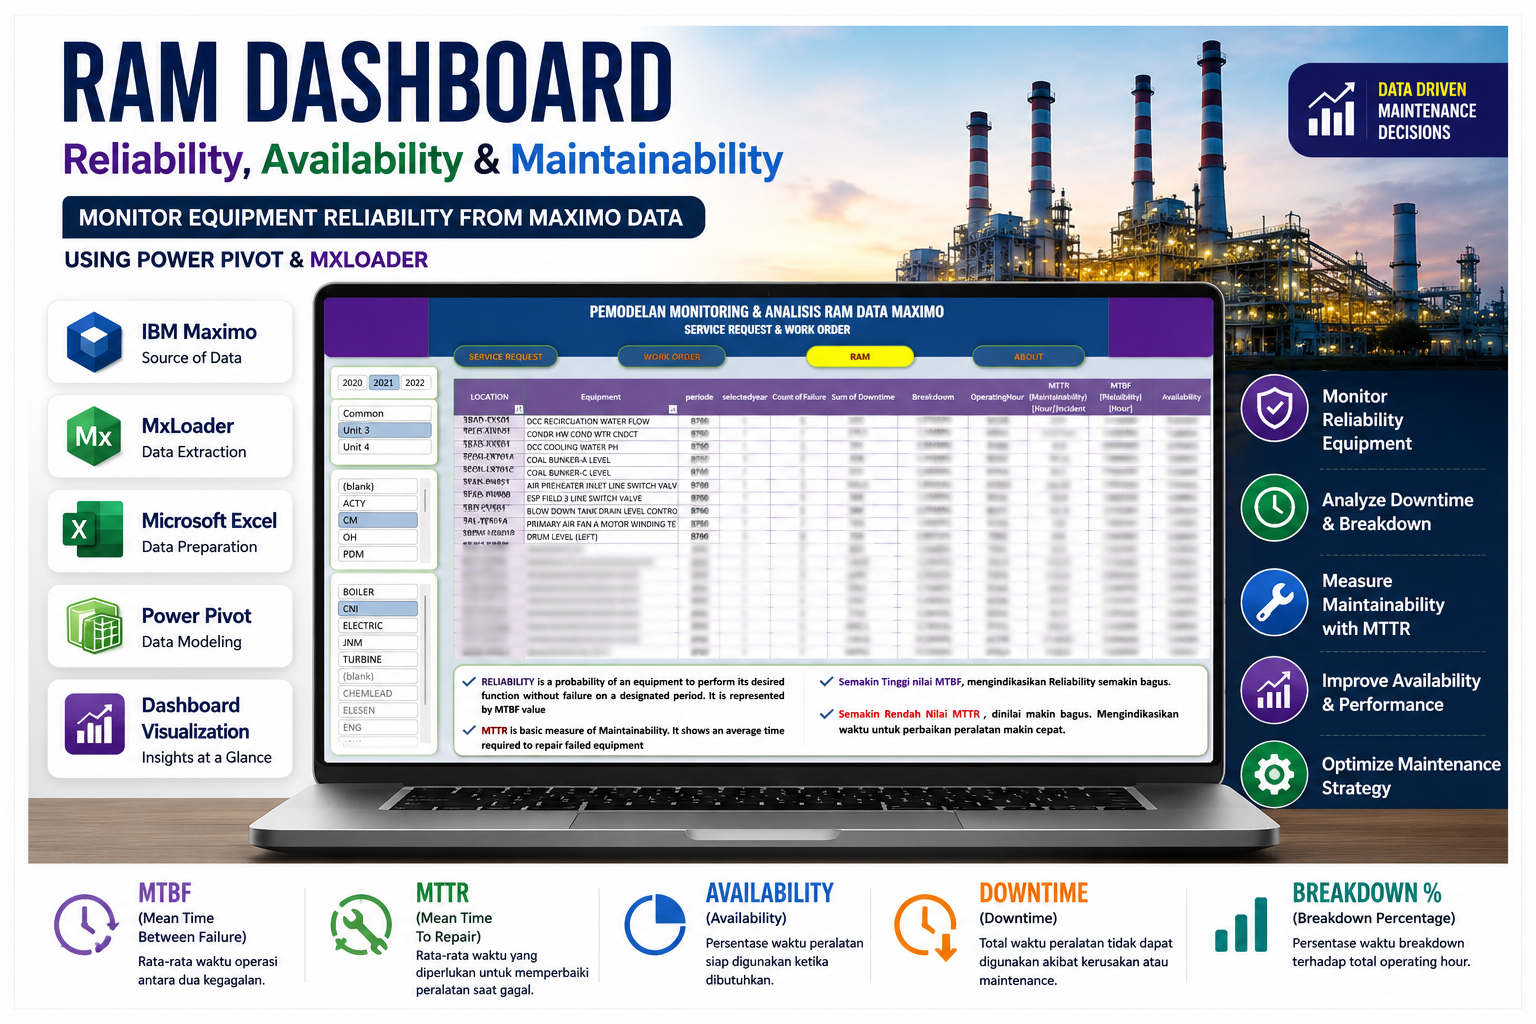
The RAM Dashboard has a different design compared to the previous dashboards.
While the earlier dashboards relied heavily on charts, this dashboard focuses more on:
– Analytical tables
– Performance indicators
– Reliability metrics
– Maintenance metrics
To protect company confidentiality:
– Some numerical values have been masked.
– Certain data has been blurred.
– Sensitive information has been intentionally omitted.
Dashboard Filters
The left side of the dashboard includes several interactive filters, such as:
– Unit
– Maintenance Type
– Team
– Equipment Area
These filters allow users to perform more detailed analysis.
For example, users can:
– View only boiler reliability
– Analyze turbine equipment
– Display only Predictive Maintenance activities
– Review data for Unit 3 only
These features make the dashboard highly interactive and flexible.
RAM Dashboard Contents
The dashboard contains several key performance indicators.
Equipment List
The dashboard displays the equipment included in the analysis.
Examples include:
– Pumps
– Valves
– Fans
– Conveyors
– Analyzers
– Motors
– Water Flow Systems
These assets form the foundation of the RAM analysis.
Operating Period
The dashboard displays the operating period or operating hours for each asset.
Operating hours are used to calculate:
– Reliability
– MTBF
– Availability
The longer equipment operates without failure, the higher its reliability.
Failure Count
This parameter shows the total number of equipment failures.
Examples include:
– Equipment failed twice.
– Equipment failed ten times.
A higher failure count generally indicates lower reliability.
Downtime
Downtime is the total period during which equipment is unavailable because of failures or maintenance.
Downtime is a critical metric because it directly affects:
– Production
– Availability
– Plant efficiency
Higher downtime results in:
– Greater operational losses
– Lower equipment availability
Breakdown Percentage
The dashboard also displays Breakdown Percentage.
This metric measures the percentage of total operating time during which equipment is in a failed condition.
High breakdown percentages typically indicate:
– Reduced reliability
– Increased maintenance costs
– Higher operational risk
Operating Hours
Operating Hours represent the total time equipment has been in service.
This value serves as the basis for calculating reliability and availability.
Example:
– Equipment operates 8,000 hours per year.
– If downtime remains minimal, availability will be high.
MTTR (Mean Time to Repair)
MTTR represents the average time required to repair equipment after a failure.
The basic formula is:
MTTR = Total Downtime ÷ Number of Failures
Lower MTTR indicates:
– Better maintainability
– Faster repairs
– Reduced downtime
Simple MTTR Example
Suppose:
– Total downtime = 10 hours
– Number of failures = 2
Then:
MTTR = 10 ÷ 2 = 5 hours
This means the average repair time is five hours.
MTBF (Mean Time Between Failures)
MTBF represents the average operating time between equipment failures.
The basic formula is:
MTBF = Operating Hours ÷ Number of Failures
Higher MTBF indicates:
– Better reliability
– More dependable equipment
– Less frequent failures
Simple MTBF Example
Suppose:
– Operating hours = 1,000 hours
– Number of failures = 2
Then:
MTBF = 1,000 ÷ 2 = 500 hours
This means the equipment experiences one failure approximately every 500 operating hours.
Availability
Availability indicates how ready equipment is for operation.
Higher availability means:
– Equipment is ready for use
– Downtime is minimized
– Plant operation remains stable
Availability is especially important in power plants because it directly affects the continuity of electricity generation.
Additional Dashboard Information
At the bottom of the dashboard, brief explanations are provided for:
– Reliability
– MTTR
– MTBF
These descriptions help users better understand the displayed performance indicators.
Reliability Indicator
The dashboard explains that:
– Higher MTBF values indicate better reliability.
This means equipment experiences failures less frequently.
Maintainability Indicator
The dashboard also explains that:
– Lower MTTR values indicate better maintainability.
This means repairs can be completed more quickly.
Why Is This Dashboard Valuable?
There are several reasons why this RAM Dashboard is particularly useful.
Transforms Data into Actionable Insights
Maintenance databases typically consist of lengthy spreadsheets.
With the dashboard:
– Data becomes easier to understand.
– Trends become immediately visible.
– Analysis becomes significantly faster.
Supports Reliability Engineers
The dashboard provides valuable information for:
– Reliability Engineers
– Maintenance Planners
– Supervisors
– Operations Teams
All critical performance indicators are available on a single screen.
Improves Decision-Making
The dashboard helps identify:
– Priority equipment
– Maintenance strategies
– Problematic areas
– Bad actor equipment
This enables more informed, data-driven decisions.
Simple Yet Powerful
Although developed using:
– Microsoft Excel
– Power Pivot
– MxLoader
the dashboard is capable of delivering advanced engineering insights.
This project demonstrates that simple tools can still produce highly effective engineering dashboards.
Challenges During Development
Several challenges were encountered while developing the dashboard.
Data Quality Issues
Maintenance data often contains:
– Duplicate records
– Missing values
– Inconsistent equipment names
– Inconsistent maintenance history
Data cleaning therefore became one of the most important stages of the project.
Calculating RAM Parameters
Calculating:
– MTBF
– MTTR
– Availability
– Breakdown Percentage
requires accurate data.
If the underlying data is incorrect, the analysis will also be inaccurate.
Large Data Volumes
Maintenance history databases can become extremely large.
Without proper optimization:
– Excel performance decreases.
– Dashboards become slower.
– Formulas become inefficient.
Power Pivot plays a vital role in processing these large datasets.
Lessons Learned
This project provided several valuable lessons.
Data Analytics Is Essential for Modern Engineers
Today’s engineers should develop skills in:
– Data analytics
– Dashboard development
– Digital tools
– Data visualization
Industrial operations are rapidly moving toward digital transformation.
Reliability Engineering Is More Than Equipment Repair
Reliability engineering involves much more than fixing equipment.
It also includes:
– Data analysis
– Failure prediction
– Maintenance strategy
– Operational optimization
Visualization Makes Analysis Easier
Visualization helps:
– Accelerate analysis
– Simplify monitoring
– Improve data interpretation
Future Development Opportunities
The dashboard has significant potential for future enhancement.
Possible improvements include:
– Power BI integration
– Real-time dashboards
– Predictive Maintenance
– AI-powered analytics
– Machine learning
– Mobile monitoring
Power BI Integration
Migrating the dashboard to Power BI would provide several advantages:
– A more modern interface
– Easier report sharing
– Faster data refresh
Power BI represents an excellent next step toward digital maintenance transformation.
The Future of Predictive Maintenance
In the future, RAM data can support:
– Failure prediction
– Downtime prediction
– Maintenance optimization
– Anomaly detection
For example, if MTBF begins to decline significantly, the system can generate an early warning before equipment failures occur.
The Importance of Data Privacy
In industrial environments, reliability and maintenance data are considered highly sensitive.
Therefore:
– Certain numerical values have been masked.
– Specific names have been blurred.
– Confidential information has not been fully disclosed.
These precautions help protect company information and maintain data security.
Conclusion
The project, “Reliability, Availability, and Maintainability (RAM) Dashboard from Maximo Data using Power Pivot and MxLoader,” demonstrates how maintenance data can be transformed into valuable engineering intelligence.
Using:
– IBM Maximo
– MxLoader
– Microsoft Excel
– Power Pivot
maintenance history that originally existed as lengthy spreadsheets can be transformed into an intuitive reliability engineering dashboard.
The dashboard helps organizations:
– Monitor equipment reliability
– Analyze downtime
– Evaluate maintainability
– Calculate availability
– Support data-driven decision-making
Although it was built using relatively simple tools, the dashboard provides valuable insights for maintenance and reliability engineering.
Projects like this also demonstrate that today’s engineers should develop expertise in:
– Data analytics
– Digital maintenance
– Dashboard visualization
– Reliability engineering
As the future of industry continues to move toward:
– Smart maintenance
– Predictive analytics
– Digital transformation
– Data-driven decision-making